A tale of two valuations does not necessarily imply US equities are expensive
Since the US equity market bottomed out, its subsequent rebound has caught many investors off-guard.
An update on our separation
Professional Services will now be known as S&W. Find out more.
Since the US equity market bottomed out, its subsequent rebound has caught many investors off-guard. Investors are taking a closer look at valuations. From a cursory glance, US equity price-to-earnings (PE) ratios may seem expensive based on downward revised company earnings (Earnings Per Share, or EPS) for 2020. However, perhaps a more nuanced approach is required to analyse company valuations, PE ratios based on upward revised 2021-2022 EPS expectations do not look as demanding (chart 1). Given the assumption that US output restarts and earnings can return, US equities could look more reasonably priced.
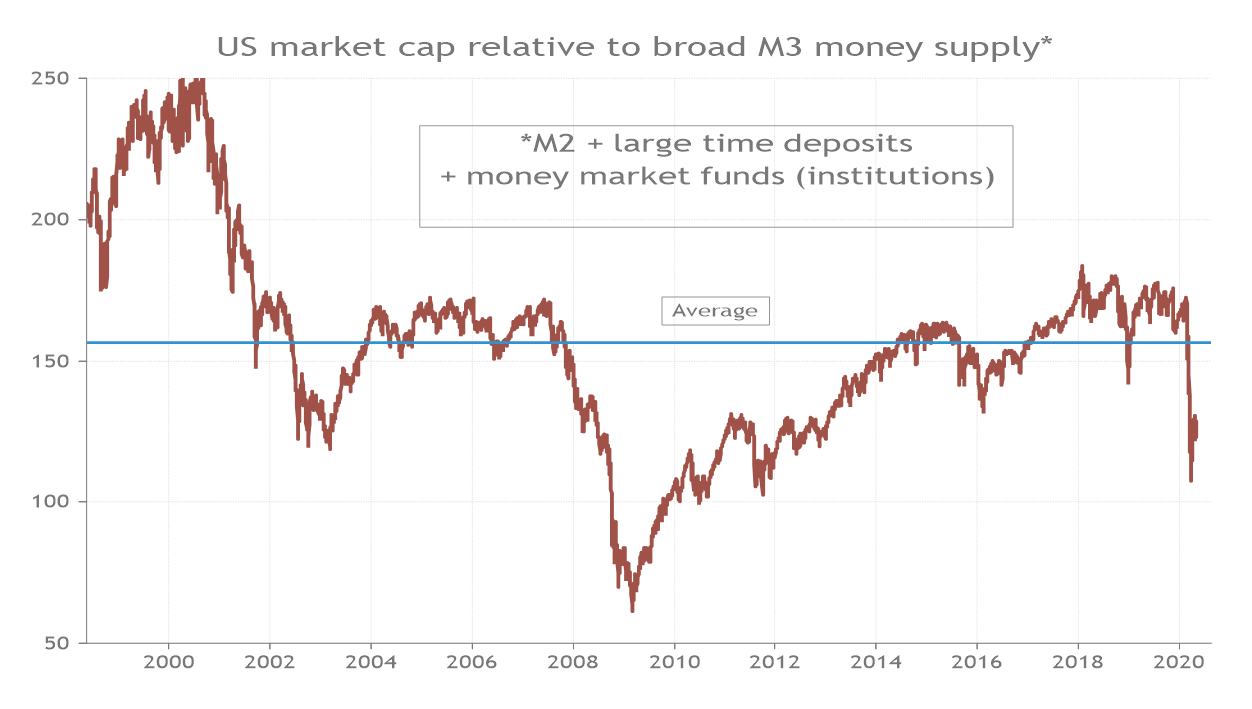
Moreover, equities should also probably be valued against record amounts of funding that the authorities have injected into the financial system to shore up struggling businesses and households from lockdowns during the COVID-19 outbreak. For example, if market capitalisation is compared against M3 broad money supply (a measure of money flowing around the financial system including saving deposits and currency in circulation), then equities do not look that demanding relative to history.

Source: Refinitiv Datastream/Smith & Williamson Investment Management LLP, as at 20 May 2020
The US S&P 500 PE ratio is currently trading on 22.6x 2020 EPS expectations, the highest level for 18 years, thanks to both the equity rally and falling EPS expectations1. COVID-19 has and will continue to have, different degrees of impact on different sectors> However, company earnings for 2020 are generally forecast to be down across the board. Meanwhile, equity markets have rebounded impressively since their trough on 23rd March, giving the deceptive impression of a return to normality. The result of these factors is an elevated 2020 PE ratio, which is further from its 3-year moving average (in terms of standard deviations) than it has been at any point in the last 30 years (chart 2)2. Considering this alone, investors are paying high prices for low earnings.
Source: Refinitiv Datastream/Smith & Williamson Investment Management LLP, as at 20 May 2020
Despite poor 2020 earnings, economic forecasts are leading analysts to revise company EPS up for 2021-2022. When PE multiples are based on 2021-2022 earnings, valuations appear a lot less demanding. The PE ratios for 2021 and 2022 are 17.5x and 15.0x, respectively, both of which are broadly in line with their 3-year rolling averages and are lower than pre-COVID-19 levels (chart 3)3.
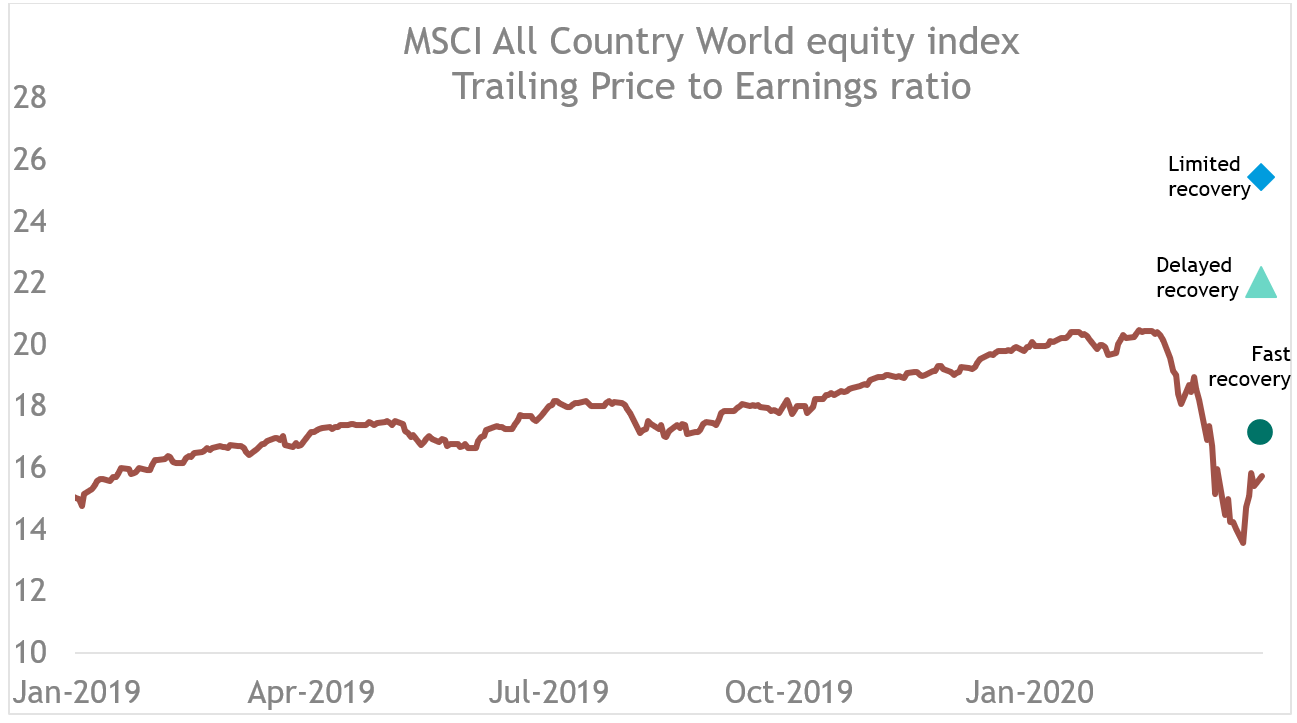
In short, if COVID-19 is viewed as an aberrant event impacting 2020 company earnings only, then the choice of valuation metrics should be adjusted accordingly. For those who believe that the current global situation of lockdowns and low earnings will remain, then 2020 PE ratios makes sense as it provides an accurate picture of the current situation. For others, further forward-looking metrics like 2021 and 2022 Pes provide a more accurate picture.
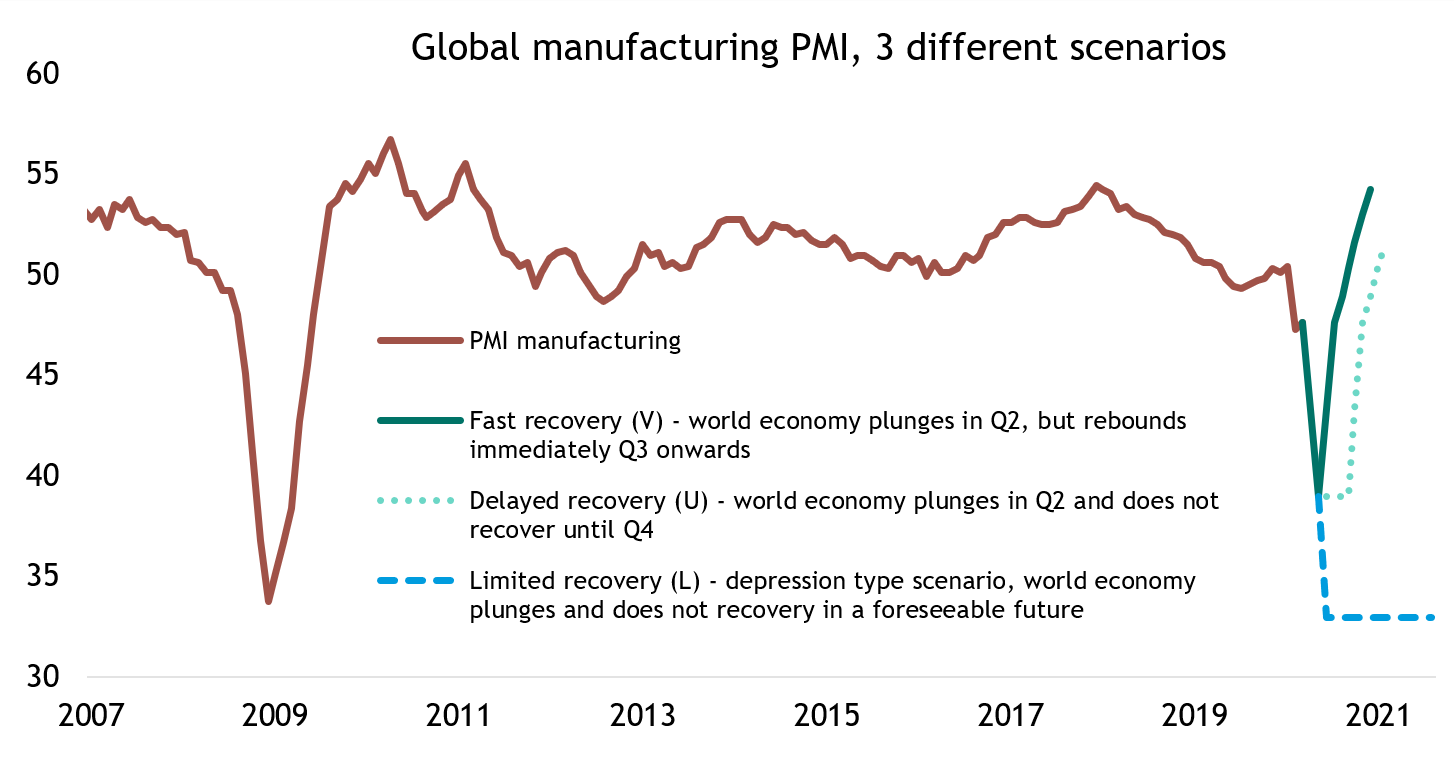
Our house view remains tilted towards an economic recovery that increases the probability of 2021 and 2022 EPS expectations being broadly met. Crucial to this is the fact that government furlough schemes are providing consumers with an income and confidence that they will return to a job. Some sectors will inevitably suffer long term structural damage, but it seems that COVID-19 is manifesting as a short-sharp natural disaster type of crisis, rather than a drawn-out recovery like the aftermath of the Global Financial Crisis (GFC) of 2008.
One way to observe this phenomenon is through the US labour market. We suspect that the significant increase in US initial jobless claims over the past few months closely resembles a natural disaster, rather than a cyclical economic downturn. For instance, when Hurricane Katrina hit Louisiana in August 2005, state jobless claims jumped by 25 times up to September of that year, and immediately declined afterwards (chart 4)4. A similar pattern can be seen today; US national jobless claims rose by 32 times in March due to COVID-19 lockdowns5. Jobless claims are now trending down as they did in Louisiana back in September 2005. In contrast, it took a long time for joblessness to come back to normal levels after the GFC.
Source: Refinitiv Datastream/Smith & Williamson Investment Management LLP, as at 20 May 2020
Given this view, assessing equities on a 2-3y forward PE basis is probably prudent and importantly, provides evidence to suggest that equity valuations are not necessarily expensive. Of course, a lack of clarity still mists forecasts. With no vaccine in circulation and the possibility of secondary outbreaks, it is possible that normality will not return soon. Ultimately the market price of a company is a forward-looking indication of the company’s future earnings. Thus, assessing equity valuations needs to be done in conjunction with macroeconomic views of when earnings will return.
As shown earlier, trying to assess value through PEs at this juncture could be misleading. Analysts may be slow to upgrade or downgrade numbers because of their behavioural bias, anchoring on what they have said previously. Forward guidance from individual firms, which forms part of analysts’ views, has been lacking. With so much uncertainty over company earnings, it may be more appropriate to consider valuations that incorporate the increase in money supply from policy stimulus. As we discussed in our Risk of high inflation beyond the near-term, 1 May Webinar, this liquidity ends up in broad M3 money supply. The latest data shows M3 money supply is growing at nearly 25% from a year ago, the fastest pace from data going back to 19826. It would be reasonable to expect some of this cash generating minimal returns in low interest deposits and money market funds to eventually trickle its way into the stock market. Currently, US stock market capitalisation is valued at 122% of broad money supply, its lowest level since 2012 outside of this year’s sell-off and is below the long-term average of 156%7. Arguably, not all this money will go into the stock market, but investors at some point may decide to take on more risk in equities. Furthermore, given the scale of the money flowing into the financial system, institutional investors may be underweight equities, encouraging them to top up equity positions in the future.
Source: Refinitiv Datastream/Smith & Williamson Investment Management LLP, as at 20 May 2020
In conclusion, PE valuation metrics are giving mixed messages. If one is of the view that the collapse in earnings will be permanent, then use of an elevated 2020 PE ratio makes sense. But if you believe society will return to some semblance of normality then one must look beyond the crisis and consider less demanding valuations based on 2021-22 EPS.
The added twist is that given the unprecedented monetary/fiscal stimulus, valuations should also probably be compared with the record amounts of liquidity injected into the monetary system. On that basis, equities do not look that expensive.
Provided output recovers as the US government opens the economy after COVID-19, there is potential room for valuations to expand from here over the next 12 months. A big unknown is whether we get another COVID-19 outbreak as lockdowns are lifted. The key question is will governments impose similar travel restrictions knowing the economic impact and potential social backlash, as populations grow weary of being locked down.
Please note specified government legislation is that prevailing at the time, is subject to change without notice and depends on individual circumstances
Sources:
1 Refinitiv Datastream/ Smith & Williamson Investment management LLP/ 20/05/2020
2 Refinitiv Datastream/ Smith & Williamson Investment management LLP/ 20/05/2020
3 Refinitiv Datastream/ Smith & Williamson Investment management LLP/ 20/05/2020
4 Refinitiv Datastream/ Smith & Williamson Investment management LLP/ 20/05/2020
5 Refinitiv Datastream/ Smith & Williamson Investment management LLP/ 20/05/2020
6 Refinitiv Datastream/ Smith & Williamson Investment management LLP/ 20/05/2020
7 Refinitiv Datastream/ Smith & Williamson Investment management LLP/ 20/05/2020
DISCLAIMER
By necessity, this briefing can only provide a short overview and it is essential to seek professional advice before applying the contents of this article. This briefing does not constitute advice nor a recommendation relating to the acquisition or disposal of investments. No responsibility can be taken for any loss arising from action taken or refrained from on the basis of this publication. Details correct at time of writing.
Please remember investment involves risk. The value of investments and the income from them can fall as well as rise and investors may not receive back the original amount invested. Past performance is not a guide to future performance.
Evelyn Partners Investment Management LLP
Authorised and regulated by the Financial Conduct Authority.
Registered in England No. OC 369632. FRN: 580531
Evelyn Partners Investment Management LLP is part of the Evelyn Partners group.
© Evelyn Partners Group Limited 2021
Ref: 72320eb
This article was previously published prior to the launch of Evelyn Partners.
Some of our Financial Services calls are recorded for regulatory and other purposes. Find out more about how we use your personal information in our privacy notice.
Your form has been submitted and a member of our team will get back to you as soon as possible.
Please complete this form and let us know in ‘Your Comments’ below, which areas are of primary interest. One of our experts will then call you at a convenient time.
*Your personal data will be processed by Evelyn Partners to send you emails with News Events and services in accordance with our Privacy Policy. You can unsubscribe at any time.
Your form has been successfully submitted a member of our team will get back to you as soon as possible.
