Global company earnings expectations for 2020 and beyond
The global economy is on track to deliver its lowest real GDP growth rate since the end of the Second World War.
An update on our separation
Professional Services will now be known as S&W. Find out more.
The global economy is on track to deliver its lowest real GDP growth rate since the end of the Second World War. Given the relationship between GDP, company top-line sales revenues and fundamental earnings (or Earnings Per Share, EPS), analysts have lowered their global forecast EPS growth estimates to fall just -1.6% for 2020 from 10% at the start of the year. However, given the severe movement restrictions imposed by governments in response to the coronavirus pandemic, as well as the expected deterioration in consumer and business confidence, the current consensus EPS estimate is probably still too high and has room to fall further as analysts upgrade their estimates.
Global equity earnings in 2020 will ultimately depend on how long the lockdowns remain in place. Essentially, the quicker the lockdown measures are lifted, the faster economic activity and company earnings can recover. Over the next few months much time will be devoted to deciding whether the economic recovery will be fast (V-shaped), delayed (U-shaped) or limited (L-shaped).
Looking back over the past 50 years, we find that six out of the past seven US economic recoveries from recession have been fast. The exception being after the Global Financial Crisis in 2008 when the private sector (households and businesses combined) were overleveraged and which resulted in a U-shaped recovery. Encouragingly, private sector debt has risen by just 2% of GDP over the past five years, the least amount ahead of the last seven recessions so this shouldn’t be a headwind this time. However, other scenarios are less positive for the fundamental drivers of equities and accordingly there are still large risks to an earnings recovery. In the rest of this piece, we estimate what is discounted in equity valuations and assess the long-term implications.
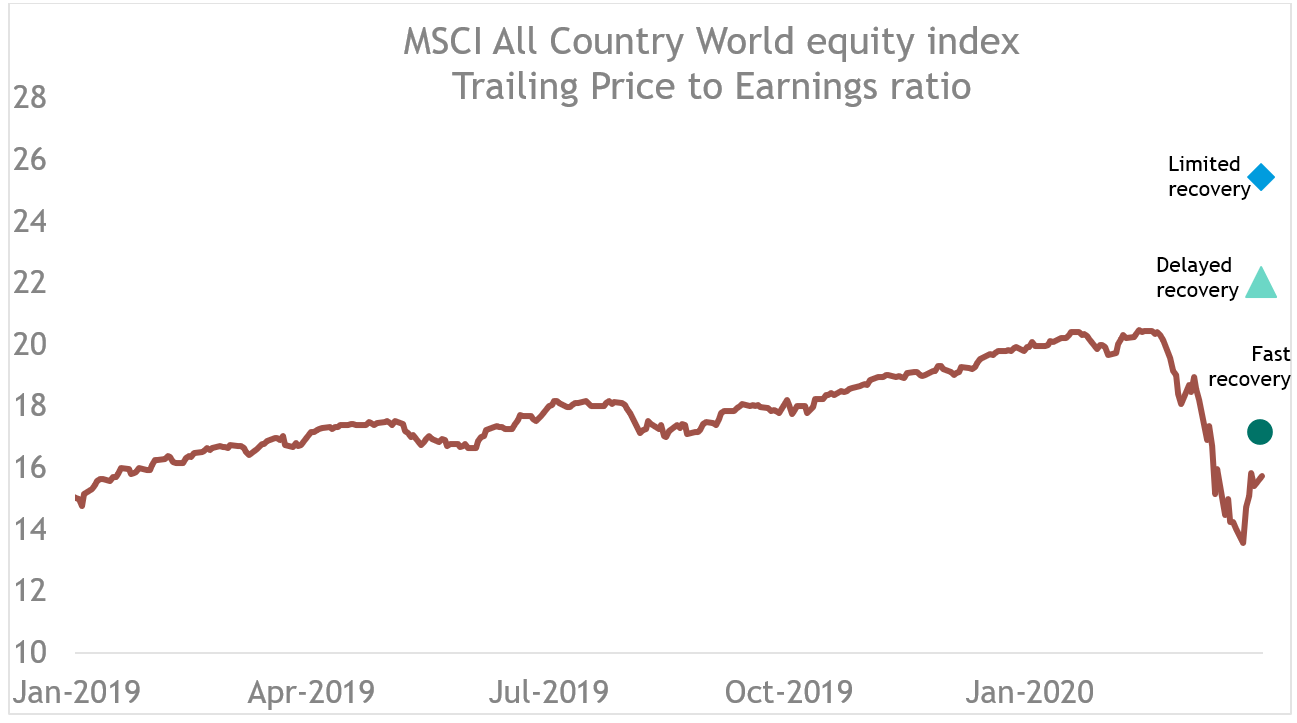
In order to estimate company profits for 2020 we use the global Purchasing Manager Index (PMI), as a proxy for global growth. This historically leads the MSCI All-Country World Equity Index yearly trailing earnings growth by around 5 months (chart 1):

Source: Refinitiv Datastream, calculations by S&W Investment Strategy, as at 1st April 2020
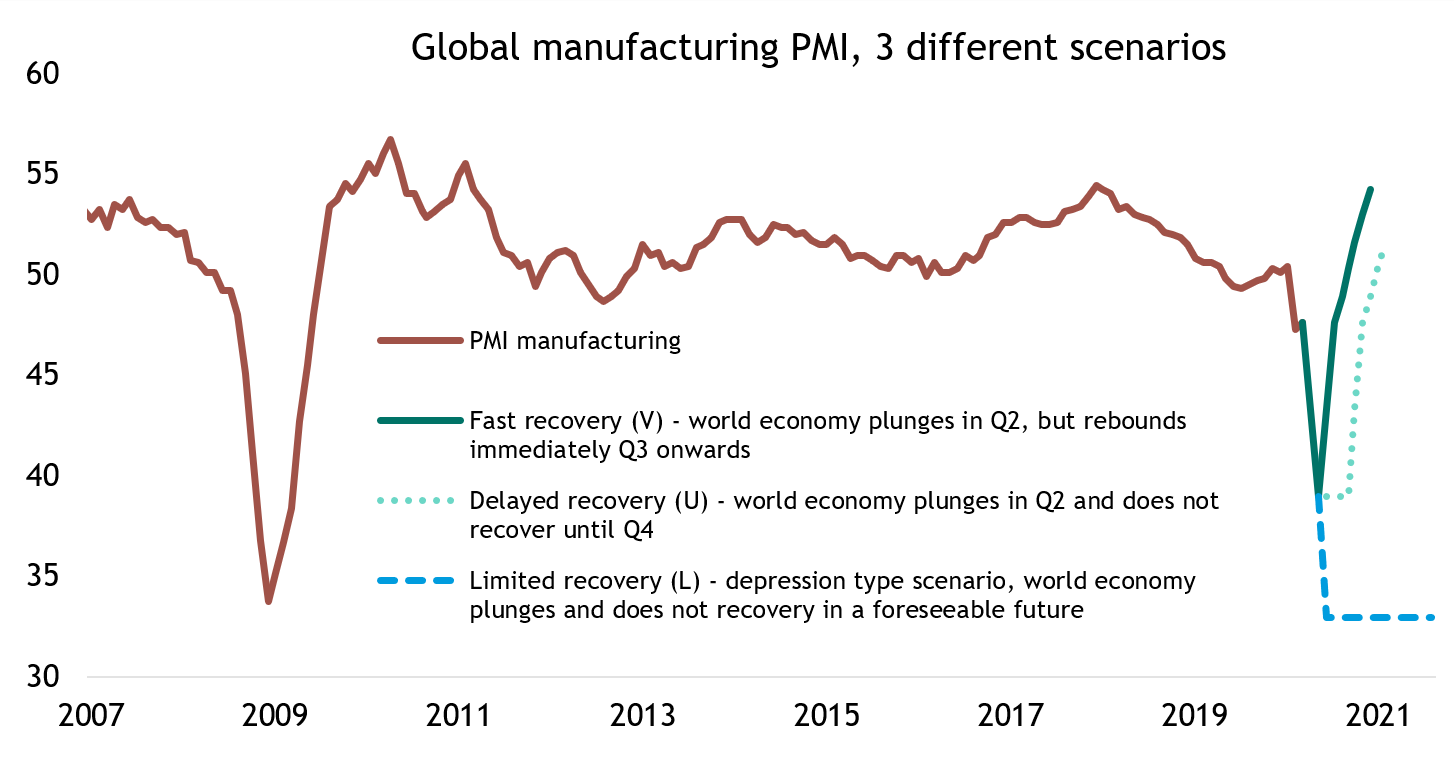
We then set out three scenarios for global growth using projections of PMI to the end of 2020 (chart 2). In a fast recovery scenario, we assume the global manufacturing PMI declines to 39 in May (similar to China’s February reading), before it rebounds afterwards to reach 54 by the end of this year. In the delayed recovery scenario, the global PMI also falls to 39, but growth does not start until Q4 2020. Finally, in the limited recovery scenario, the global manufacturing PMI falls further to 33 by the summer and recovery is limited!
We then use the statistical relationship (i.e. regression) between the global PMI and company earnings to calculate EPS growth estimates for 2020. According to our calculations, the three scenarios would result in earnings contraction of -7%, -38% and -59% for fast, delayed and limited recovery scenarios, respectively. Clearly, these numbers show there is downside risk to the current consensus global EPS estimate of nearly -1.6% for 2020.
To determine whether the market is cheap or expensive, we use our trailing EPS estimates under the three scenarios to adjust the current price to earnings (PE) multiple to get a more dynamic valuation as shown in chart 3 below. Under the fast recovery, we estimate the market is currently valued at a PE of 17.1x; this is around 7% higher than the actual current reported PE of 16.0x, which is the lowest valuation multiple (outside of the recent sell-off) for over a decade. The delayed and limited recoveries generate PE multiples of 22.0x and 25.4x, respectively, which on these scenarios suggest the market is not so cheap on a short-term basis.
One drawback from this simple analysis is that it fails to account for possible structural changes in how consumers, firms and governments operate in a post-coronavirus world. For example, consumers could potentially save more to safeguard against future pandemics or on the expectation of tax increases to pay for the current bailout of the private economy during this crisis. There could also be less discretionary spending on holidays unless a coronavirus vaccine is available and perhaps, less frequent visits to crowded places like restaurants, cinemas, stadiums etc. Lower company profitability means less confidence and less capital available for investment, and more focus on cost cutting. While governments are likely to continue with ongoing fiscal largesse, it seems likely that they will struggle to offset lost output from the private sector.
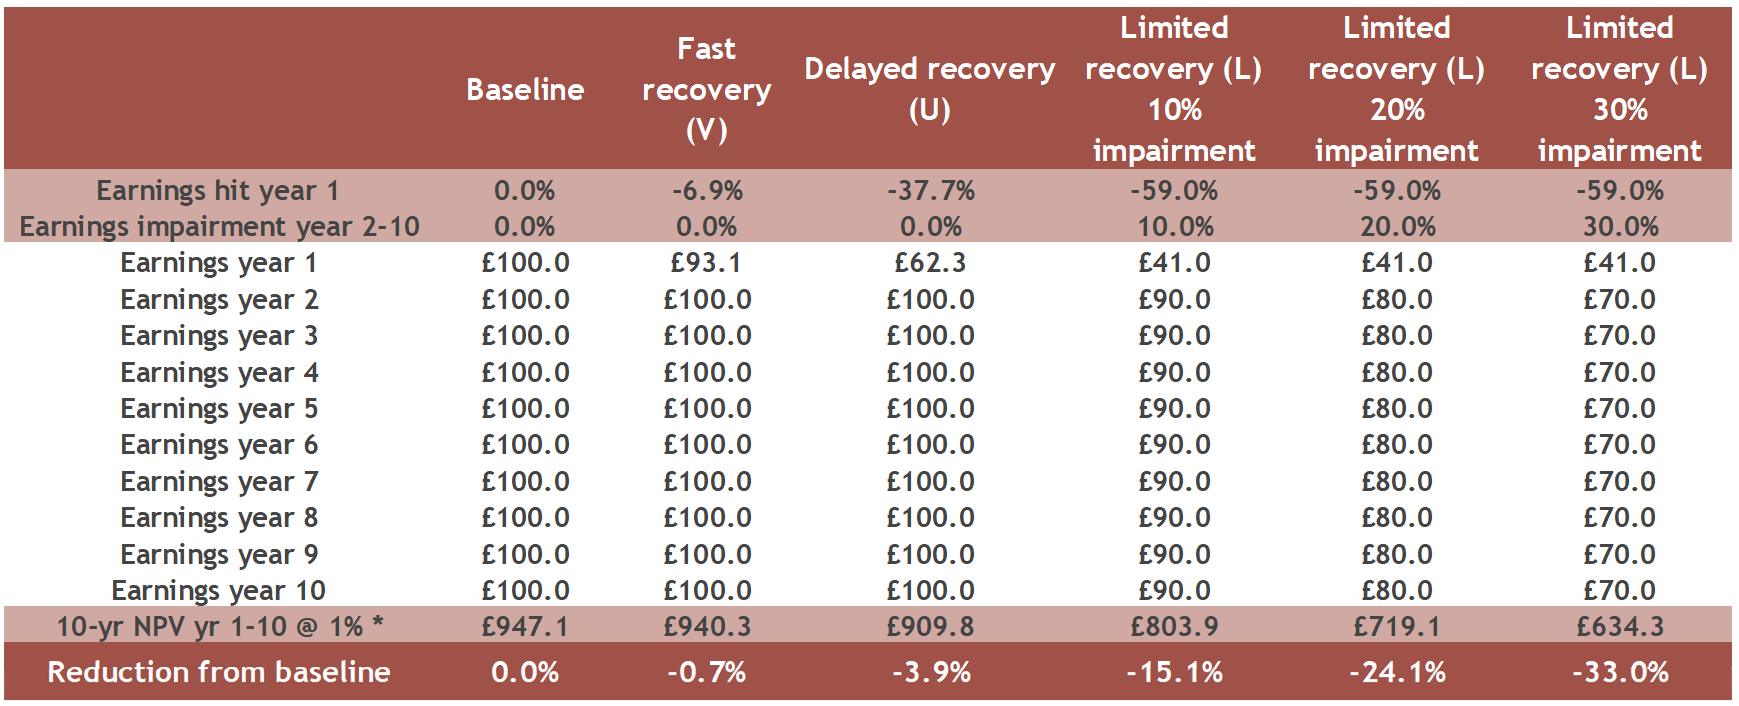
To capture the potential long-lasting damage to valuations we look at how the Net Present Value (NPV) of the three scenarios over a 10-year period using an assumed 1% discount rate as shown in table 1 below. The NPV is a way of calculating what something is worth now, based on estimates of future earnings discounted back to the present. By looking at the NPV compared to a baseline, we can estimate the long-term impact. For the first two scenarios, the NPV calculation shows very little difference to the baseline on a 10-year view. However, in the limited recovery scenario, where we assume a material 30% reduction of future earnings from year 2 to year 10, then the NPV would be a third less than the baseline.
To sum up, given that the MSCI All-country World Equity Index is currently down 20% from its mid-February peak, the market could be pricing in an approximate 20% impairment in long-term future earnings. Based on our simple analysis, for long term investors there are two possible outcomes. First, is that if global growth and company profitability broadly recover the sell-off provides an immediate buying opportunity. Or second, if the coronavirus has done long-lasting damage to the ability of companies as a whole to generate earnings, then investors need to work out whether that long lasting damage is greater than the 20% impairment priced into markets now to decide whether markets represent good value on a ten year view. In practice the market is not so simple, but the approach provides a useful decision framing structure.
DISCLAIMER
By necessity, this briefing can only provide a short overview and it is essential to seek professional advice before applying the contents of this article. This briefing does not constitute advice nor a recommendation relating to the acquisition or disposal of investments. No responsibility can be taken for any loss arising from action taken or refrained from on the basis of this publication. Details correct at time of writing.
Please remember investment involves risk. The value of investments and the income from them can fall as well as rise and investors may not receive back the original amount invested. Past performance is not a guide to future performance.
Evelyn Partners Investment Management LLP
Authorised and regulated by the Financial Conduct Authority.
Registered in England No. OC 369632. FRN: 580531
Evelyn Partners Investment Management LLP is part of the Evelyn Partners group.
© Evelyn Partners Group Limited 2021
This article was previously published prior to the launch of Evelyn Partners.
Some of our Financial Services calls are recorded for regulatory and other purposes. Find out more about how we use your personal information in our privacy notice.
Your form has been submitted and a member of our team will get back to you as soon as possible.
Please complete this form and let us know in ‘Your Comments’ below, which areas are of primary interest. One of our experts will then call you at a convenient time.
*Your personal data will be processed by Evelyn Partners to send you emails with News Events and services in accordance with our Privacy Policy. You can unsubscribe at any time.
Your form has been successfully submitted a member of our team will get back to you as soon as possible.


