The sight of a queue can evoke a range of emotions. Despair, panic, frustration or perhaps patriotism for some British citizens. However, the queues outside shops on 15th June was a sight of hope for many. Consumers stood patiently in line ready to spend their hard-earned cash, helping to reignite economies decimated by months of global lockdowns. Closed shops, pubs, airports and high unemployment led the UK’s GDP to fall by a record 20.4% in April1.

Although catastrophic, COVID-19 has impacted the demand side of the economy, which may allow for economic recovery. Traditional high-frequency indicators support this narrative, having rebounded strongly in May and June, suggesting some return to normality. Alternative high-frequency data such as Google’s Mobility Index, demonstrate more normal movement patterns are resuming1. Undoubtedly, the road to recovery remains rocky as acute risks remain. Recovery hinges on whether a second wave of COVID cases emerges. Ultimately, some sectors will never recover, trends will accelerate, and time will be needed.
Stock markets are understood to be ‘leading indicators’ for the economy. Macroeconomic data and forecasts are analysed with investors buying and selling at what they consider fair value for future profits. This data has been unprecedently bad in 2020. However, economists are confident of a recovery in 2021 with consensus suggesting a recovery for real GDP. Currently, global equity markets are discounting this global economic recovery. The MSCI All Country World index is close to its January levels, whilst individual stock markets across the globe have shown rapid bounce-backs (chart 1). Investors have faith in an economic re-emergence from lockdowns and are happy to queue patiently for long term gains. Over the last 7 recessions, equities have troughed 2.7 months before the recession ended. We believe this to be happening now, with the current market bottom, 23rd March, being 2.9 months ago2.
Chart 1: Stock markets are discounting a global economic recovery
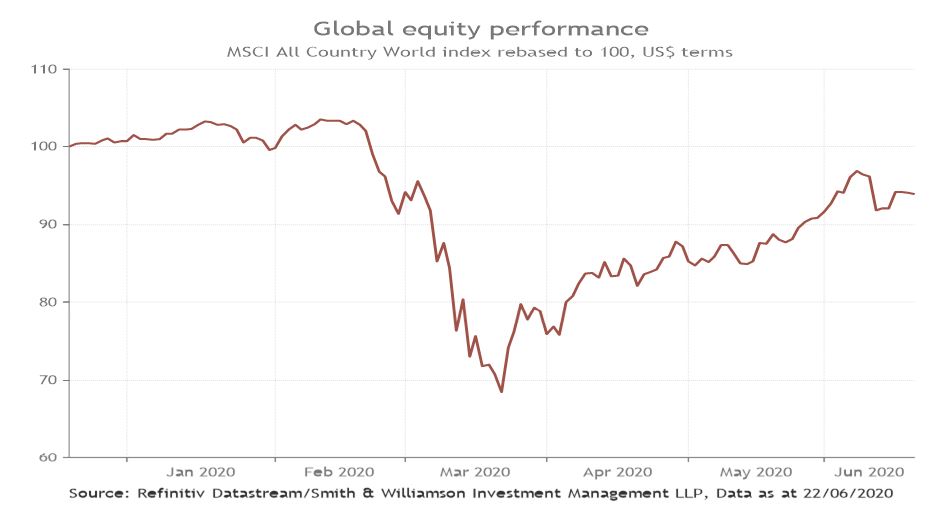
Source: Refinitiv Datastream/Smith & Williamson Investment Management LLP, Data as at 22/06/2020
To understand why markets have discounted a recovery, traditional timely indicators that provide a moving picture of economic activity can be used. Gasoline demand presents itself as an obvious candidate, fuelling global transportation and industrial production. Likewise, mortgage purchase applications are considered a leading indicator for the housing market and demonstrate the confidence of consumers looking to borrow. As chart 2 shows, both dropped sharply in the US as lockdowns were initiated. Demand for gasoline plummeted with transport stationary. However, since mid-April, both indicators have sharply rebounded. Industrial activity and transport are resuming, shown by the rising gasoline demand. Meanwhile, mortgage purchase applications have reached their previously highest levels thanks to low interest rates, increased economic certainty and pent up demand from the recent inactive market. Not all mortgage applications will have been approved as banks have become more risk averse in recent months. However, the data is still indicative of a sharp rebound in recovery, albeit perhaps to a slightly lesser extent.
Chart 2: Traditional timely indicators point to economic recovery
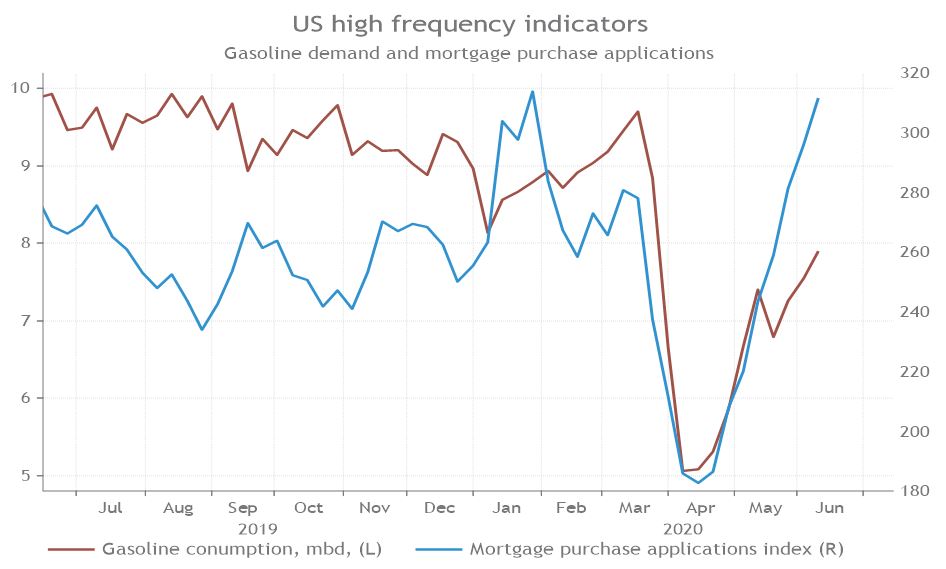
Source: Refinitiv Datastream/Smith & Williamson Investment Management LLP, Data as at 16/06/2020
As technology becomes an ever more integral part of the world, it provides us with more data to analyse. The concept of ‘alternative data’ has been growing in the financial world, with investors seeking to gain an edge through any data source. Examples range from satellite imagery to email receipts. These data sources provide a unique and timely insight into companies, industries and economies. Google’s Mobility Index, provides an insight into day-to-day life, globally. By comparing the percentage change from a baseline figure across a variety of high-level categories, we can map changes as a result of COVID-19 on a granular basis. Our ‘heatmaps’ below analyse 9 countries across 4 categories. Hong Kong, Japan and South Korea represent the Asian segment of our analysis and those countries who were ‘first-in, first-out' of lockdown. China does not allow Google. The UK, US and Germany stand for developed markets, whilst Russia, Brazil and India for the Emerging Markets. Importantly, mobile phone ownership and therefore Google’s penetration into emerging markets is not as strong as in developed markets, so the data could be less representative. As our heatmaps show, the effect of national wide lockdowns was severe. Retail and recreation were hit hardest as non-essential shops shut and recreational activities ceased. Whilst undoubtedly some of this will have been offset by increased online activity, the retail and leisure industries have suffered. However, as lockdowns ease, mobility and activity are recovering. The data from those countries to first ‘unlock’, clearly demonstrates this. Similarly, we are beginning to see a marked recovery in the developed market countries, albeit from a deeper trough. Notably, the UK is lagging the rest of the world in terms of recovery. But, the general direction towards recovery is clear and the growth story continues.
Emerging market countries lag as lockdowns continue and virus cases remain relatively high. Data from the Grocery and Pharmacy category shows a similar story. As ‘essentials’, their change from the baseline was less dramatic, but a similar sharp drop and subsequent recovery story can still be seen.
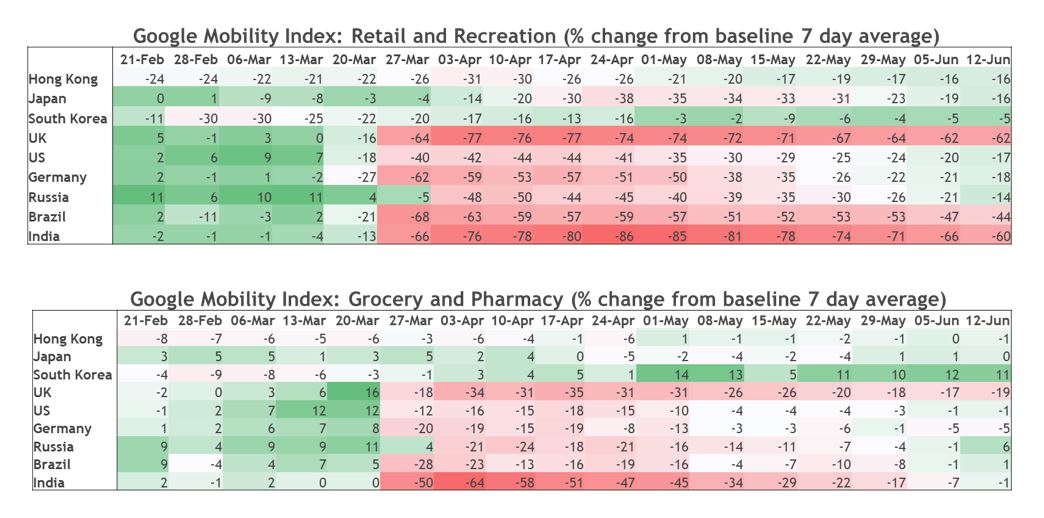
Source: Google Mobility Index/Smith & Williamson Investment Management LLP, Data as at 18/06/2020
Changes to workplace and public transport use also show improvement, although less so than retail and grocery. As working from home measures were adopted, a rapid decline in commuting and ‘office time’ ensued. Now workers are beginning to return to the office and public transport use is rising. The relative slowness of these index’s recovery (below), may lie in the fact that working from home is more feasible than expected. Technology has allowed employees to productively work from home, whilst saving time spent on tubes, buses and trains. We expect change in the way that companies work. However, for now, the signs of recovering transit and workplace indexes are positive, suggesting a return to normality.
Source: Google Mobility Index/Smith & Williamson Investment Management LLP, Data as at 18/06/2020
As the first country to enter and emerge from a national lockdown, China is an example to the rest of the world. Unfortunately, gathering reliable data from China is often difficult but here we look to China’s housing market. Chart 3 demonstrates a recovery in housing transactions from certain cities in China, including Wuhan. Similarly, commodity prices are increasing due to a pick-up in demand. Copper, a key component in manufacturing, is often viewed as a leading indicator of industrial activity. As chart 4 demonstrates, copper inventory at the Shanghai Futures exchange is at a cyclical low point, suggesting it is being used. Although only two parts of a bigger picture, we believe that the data from the Chinese housing market and copper prices, supports the narrative of an economic recovery.
Chart 3: The Chinese housing market is recovering
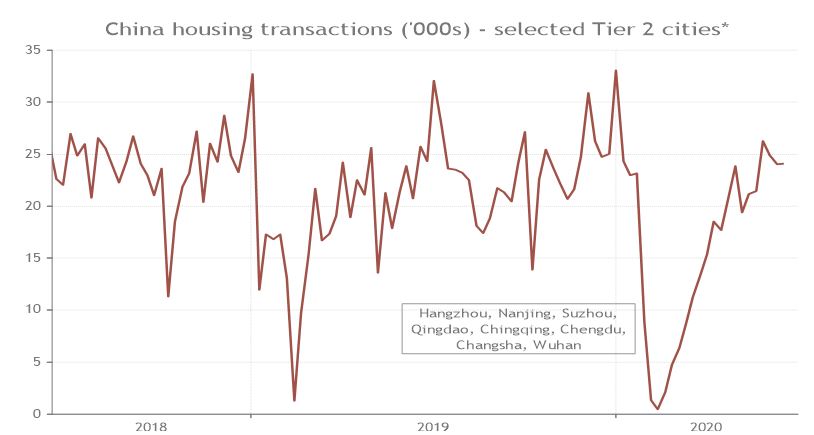
Source: Refinitiv Datastream/Smith & Williamson Investment Management LLP, Data as at 16/06/2020
Chart 4: Commodity prices are adjusting upwards from a pick-up in demand
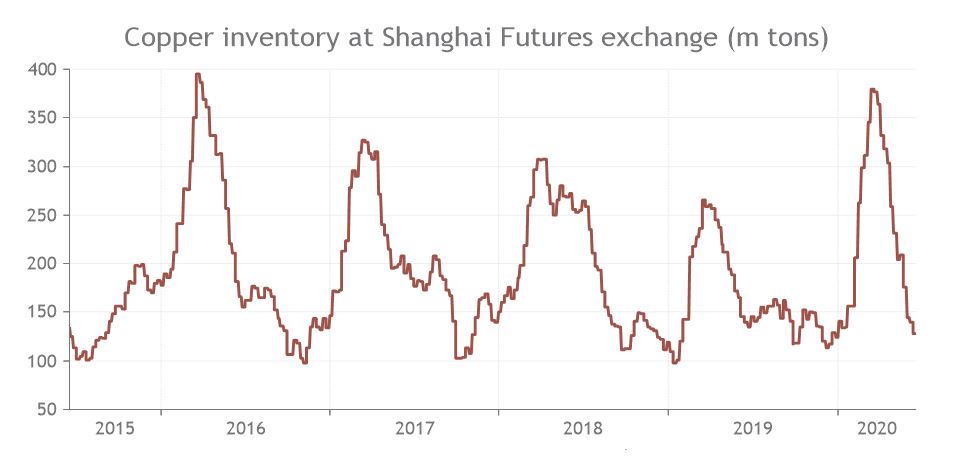
Source: Refinitiv Datastream/Smith & Williamson Investment Management LLP, Data as at 16/06/2020
This is not to say a global recovery will be shared evenly. Transport companies will suffer, whilst tech companies prosper. The change in S&P 500’s composition demonstrates this. The travel industry has been one of the hardest hit by COVID-19 and has struggled to recover from crises in the past. As chart 5 shows, after 9/11, it took 3 years for the number of total US passenger miles to recover and 8 years to recover post-GFC. Investors should take a nuanced approach to allocating capital, as a ‘global recovery’ will certainly have an element of Darwinism to it.
Chart 5: Travel takes times to recover after a crisis
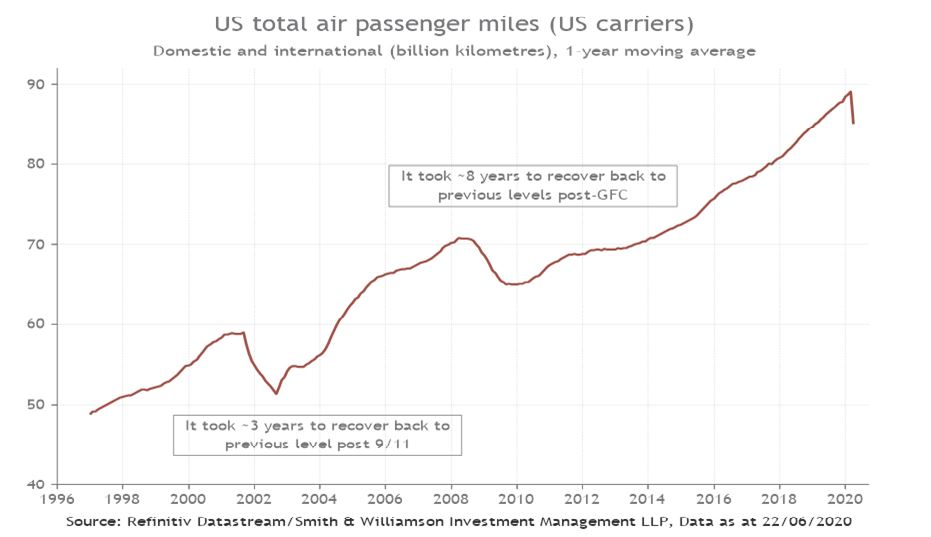
Source: Refinitiv Datastream/Smith & Williamson Investment Management LLP, Data as at 16/06/2020
On a risk/reward basis, provided there is growth, we see a distinct possibility of capital flowing into equities. Comparing US market cap relative to broad M3 money supply (a measure of money supply including institution money market funds, liquid assets, cash and near cash equivalents), valuations appear much less stretched than more conventional valuation measures, such as PE ratios, would suggest. This is due to the record amounts of US stimulus that the Fed has injected into the economy. Compared to historic levels, it is likely that this new capital could flow into equities given that money invested in bonds, money market funds and held in deposit accounts yield very little. We see money supply as a key indicator for equities and economic growth returns, as demonstrated by high frequency data, the macroeconomic environment is supportive for equities.
Chart 6: Capital could flow into equities
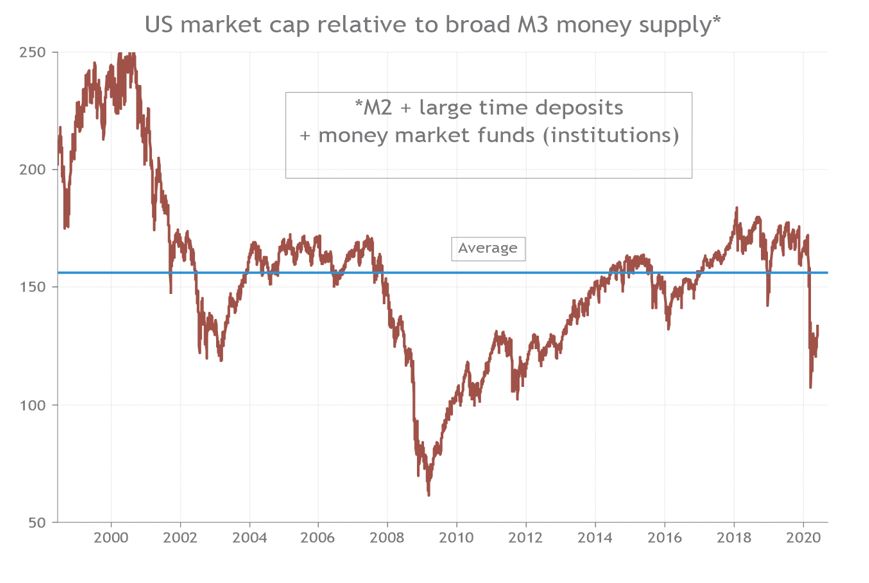
Source: Refinitiv Datastream/Smith & Williamson Investment Management LLP, Data as at 16/06/2020
A key risk to economic recovery is a second wave in COVID-19 cases. New cases have emerged in Beijing and new restrictions on movement have been implemented. Chart 7 shows that the number of new cases in US remains high, having dropped fractionally from its peak. A secondary batch of national lockdowns would be disastrous, putting increased pressure on companies, government and people. In a previous article, we spoke about the likelihood of governments opting of localised lockdowns and we maintain this will be the most likely response. Other risks persist, high unemployment, increased budget deficits, political risks. However, if coronavirus remains under control, a recovery should prevail.
Chart 7: Capital could flow into equities
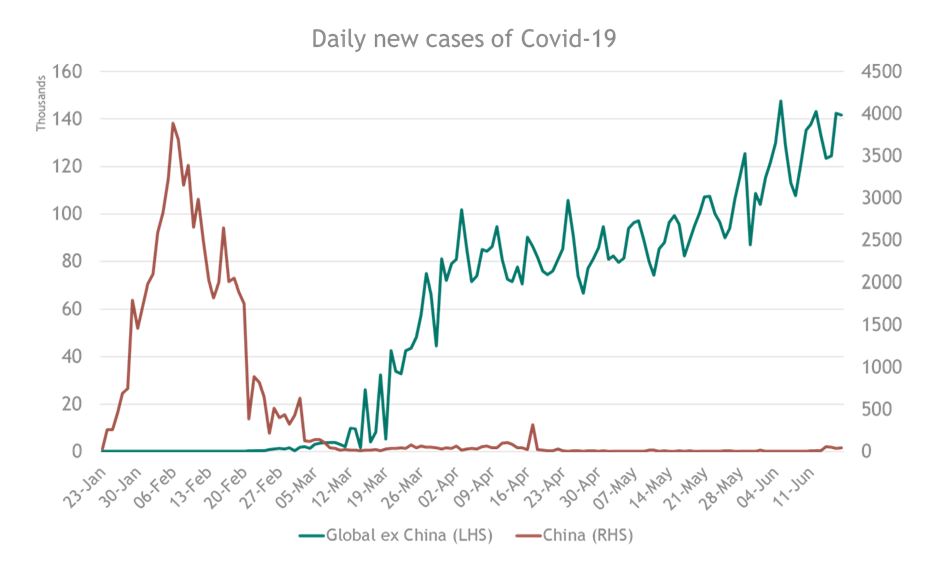
Source: Bloomberg/Smith & Williamson Investment Management LLP, Data as at 16/06/2020
To conclude, the strong rebound by global equity markets has basis, both historically and from high frequency data. It is supported by economic forecasts and discounts a global recovery. We are beginning to see this recovery manifesting itself through a variety of indicators. Traditional high frequency indicators point towards resuming economic activity, whilst alternative indicators show this on a more granular level. From what we can gather from China, this is the case here, too. Of course, winners and losers will appear and the risk of economic activity taking a while to return to pre-COVID levels remains. Nevertheless, if economies can avoid nationwide lockdowns again, we remain confident in the economic recovery.
Sources
- Refinitive Datastream/ Smith & Williamson Investment Management LLP, data as at 18/06/2020
- Refinitive Datastream/ Smith & Williamson Investment Management LLP, data as at 18/06/2020
Risk warning
Investment does involve risk. The value of investments and the income from them can go down as well as up. The investor may not receive back, in total, the original amount invested. Past performance is not a guide to future performance. Rates of tax are those prevailing at the time and are subject to change without notice. Clients should always seek appropriate advice from their financial adviser before committing funds for investment. When investments are made in overseas securities, movements in exchange rates may have an effect on the value of that investment. The effect may be favourable or unfavourable.
DISCLAIMER
By necessity, this briefing can only provide a short overview and it is essential to seek professional advice before applying the contents of this article. This briefing does not constitute advice nor a recommendation relating to the acquisition or disposal of investments. No responsibility can be taken for any loss arising from action taken or refrained from on the basis of this publication. Details correct at time of writing.
Evelyn Partners Investment Management LLP
Authorised and regulated by the Financial Conduct Authority.
Registered in England No. OC 369632. FRN: 580531
Evelyn Partners Investment Management LLP is part of the Evelyn Partners group.
© Evelyn Partners Group Limited 2021
Ref: 91820lw
Return to the COVID-19 Investment page Return to the COVID-19 homepage
