Investing in volatile markets
Investing in volatile markets
An update on our separation
Professional Services will now be known as S&W. Find out more.
Investors approach volatile markets in different ways. Some see opportunities in attempting to time the market, taking investment risk when they expect markets will rise and reducing risk by heading for cash when the market is likely to fall. This is a risky approach because there are no fool proof ways to detect market direction from one day to the next. Our hardwiring as humans also means that we tend to have behavioural biases that make it difficult to make the right decision. The opportunity cost of not being invested can be high and we are prone to conservatism after sustaining losses.
A second approach is to take a longer-term view of investing, typically remaining invested and altering the asset allocation of a portfolio to reflect prevailing views and attitudes to risk. This is the approach that we advocate and that we follow in managing our own client portfolios. But, when markets are volatile, investors do often struggle to take a long-term approach because it can mean putting up with short-term fluctuations in the value of your investments and even rebalancing your portfolio after losses.
Over short time periods the direction of markets can seem random and the return from one discrete period of time to the next can vary substantially. As an example, from 1900 to 2000 research into stock-market returns has shown that the annualised return from US equities after inflation was a healthy 6.7% even though the return in individual years was negative about a third of the time*.
More recent history shows a similar pattern too. The chart below shows the annual returns from the FTSE All Share from 2000 to 2015 along with the return for holding that index for 5 years and the return over the entire 15-year period. The worst year was 2008 when the market lost over 30%, while the best year was 2009 when the market gained nearly 30%.
However if you held equities for any 5-year period between 2000 and 2015 the worst return you would have suffered was just under a 3% loss on an annualised basis while the best return was over 15% on an annualised basis. If you held the market over the entire 15 years then your return would have been a shade over 4% on an annualised basis, but because of compounding, you would have made just over 80% in total.
The longer you spend in the market the higher the chance of experiencing a positive return and the greater that return could be.
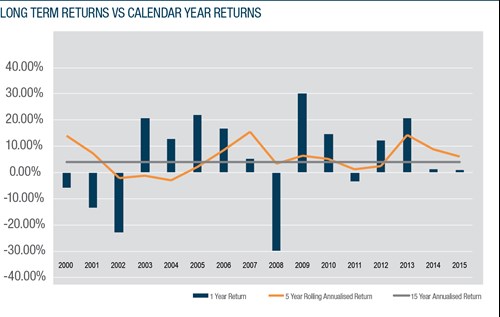
Source: Tilney Bestinvest and Bloomberg
You could give yourself an even better chance by trying to time when you are in and when you are out of the market. However, over short time periods this is a dangerous strategy because the strongest performance can take place over a relatively small number of days: we estimate that just 0.4% of trading days in the last 30 years accounted for 90% of returns.
The charts below show the total return and the annualised return from the FTSE All Share since 1985, first if you just bought and held the index, reinvesting dividends and then showing the impact of missing out on the best 10, 20 and 30 days of the FTSE through bad market timing. If you bought and held over the 30 odd years then the total return would have been a staggering 1,400%. But if you remove the 10 best days this falls dramatically to just 450%.
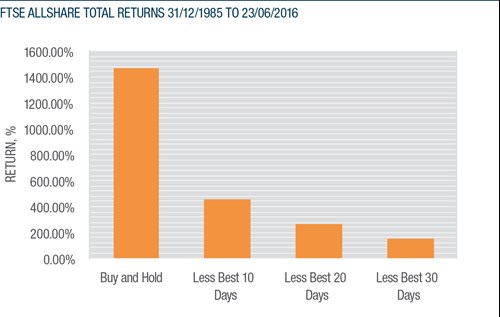
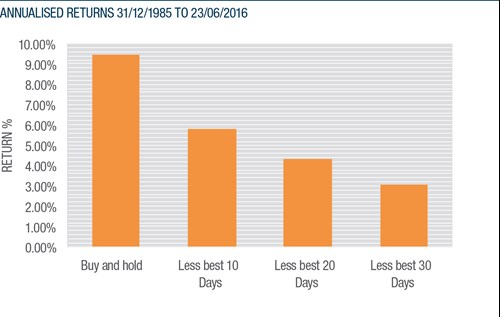
Sources: Tilney Bestinvest and Bloomberg
After the UK was ejected from the European Exchange Rate Mechanism in 1992, Black Wednesday saw sterling fall amid dire predictions for the UK, but the market bounced strongly in the following days, months and years to peak above 3,500 by February 1994. When markets are falling it can be difficult to resist the urge to sell. The table below shows the average return of the best 10, 20 and 30 days and the return that preceded those days.
| Average return on the day | Average return on the preceding day | Average return over both days | |
| Average Best 10 Days | 6.35% | -2.53% | 3.65% |
| Average Best 20 Days | 5.35% | -1.58% | 3.68% |
| Average Best 30 Days | 4.83% | -1.27% | 3.48% |
Source: Bloomberg
On average, the 10 best days in the last 30 years returned 6.4%. However, on the preceding day you would have lost 2.5%. On average, holding on for the two days together generates a positive return of around 3.5%. When markets are going through heightened volatility it can be easy to miss out as the very good returns often cluster near the very bad returns.
When you invest for the long term, there is less likelihood of sustaining losses. Over a small number of trading days market moves can be large and can seem unpredictable, but over a larger number of days the average return will tend to be positive assuming that long-term returns from investing are positive. It is possible to be more confident in the long-term return and the risk of loss. The chart below sets out this principle for a balanced portfolio of equities, bonds, alternative investments and cash.

Source: Tilney Bestinvest and Bloomberg
The chart shows the probability of losing capital over various time periods. The chance of losing capital in a typically balanced portfolio over 1 year is just over 30%. Stay in market 5 years and this probability falls to just under 17%.
We set out a framework for investors linked to both their objectives and their attitude to risk which sets out an appropriate mix of investments across the types of asset available. This long-term asset allocation shifts dynamically to reflect our views. This can mean that over shorter periods of time we may not keep pace with stock markets, but over the long term we aim to generate attractive returns above inflation. In 2015 we reduced the amount invested in stock markets even for our most adventurous clients as we felt that risk of losses had increased, not just around the EU referendum but primarily linked to the performance of the global economy and mounting risks in China. We also added to gold and sovereign bonds and increased the exposure of our clients to the US dollar which can traditionally provide a safe haven. The weeks running up to the referendum saw markets rally, only to reverse direction sharply overnight. The overall effect of our approach was that we performed much better than both the UK stock market and sterling, both of which captured headlines, because of our diversified approach. While sterling and UK equites lost value our clients made money from the parts of their portfolios invested in government bonds and gold while our holdings in dollar-priced investments performed strongly as sterling fell. Our more adventurous strategies had more invested in overseas equities, which also benefited from the falling pound.
*Triumph of the Optimists: 101 years of global investment returns, Dimson, Marsh and Staunton. Pp52. The authors highlight the annualised real returns from US equities from 1900 to 2000 was 6.7% after accounting for inflation even though real returns were negative in 1/3 of years. This included some strongly negative years like 1931 when real return was -38%.
This article was previously published on Tilney prior to the launch of Evelyn Partners.
Some of our Financial Services calls are recorded for regulatory and other purposes. Find out more about how we use your personal information in our privacy notice.
Your form has been submitted and a member of our team will get back to you as soon as possible.
Please complete this form and let us know in ‘Your Comments’ below, which areas are of primary interest. One of our experts will then call you at a convenient time.
*Your personal data will be processed by Evelyn Partners to send you emails with News Events and services in accordance with our Privacy Policy. You can unsubscribe at any time.
Your form has been successfully submitted a member of our team will get back to you as soon as possible.
