The term Emerging Market (EM) was coined by author Antoine Van Agtamel in the early 1980s. Technical definitions vary, but generally an EM is understood to be an economy with a low to middle income per capita, which is transitioning from a closed economy to a more open market economy. Countries classified as emerging market economies include countries such as Brazil, Russia, India and China. EMs are an important element of diversification in investors’ portfolios.

Developed Markets (DM), or Advanced Economies, are countries with relatively higher income, access to foreign investment and ownership and more sophisticated systems of laws and investor protection. For most investors, DMs will dominate their portfolio due to the relative stability, typically lower risk, and their much larger market capitalisation.
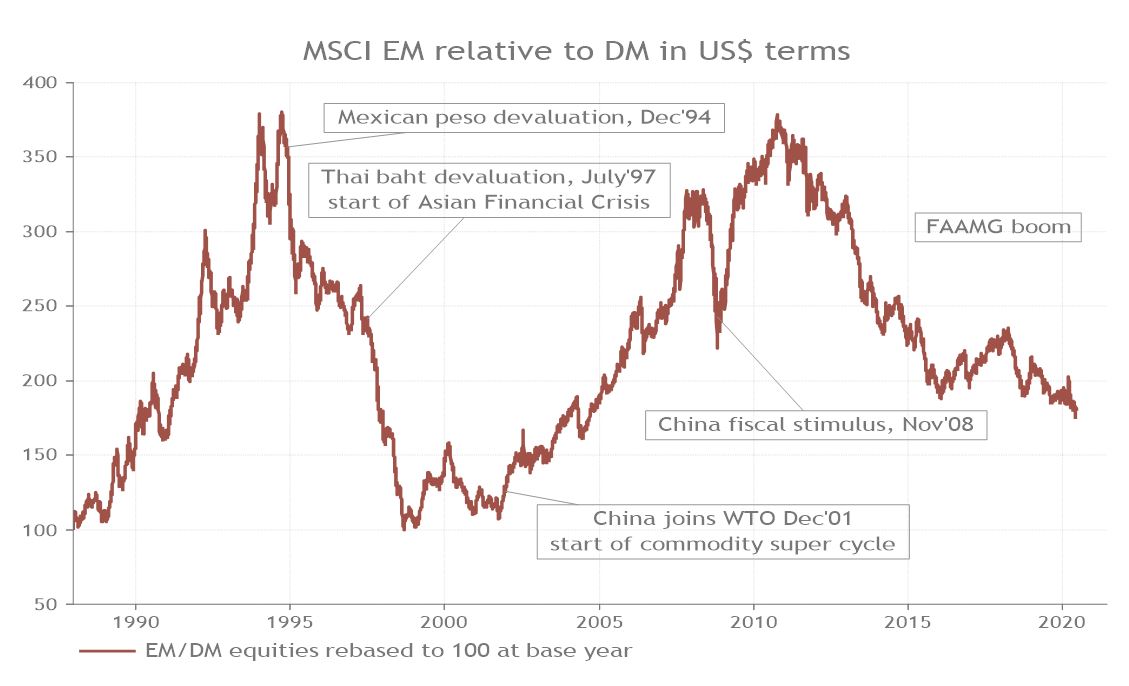
Historically, EM returns have been volatile, but periods of outperformance compared to DMs have rewarded investors and the narrative of higher levels of long-term growth persists. The ‘twin peaks’ displayed in chart 1 show the varied performance of EMs compared to their developed counterparts. From 1990 to 1994, EMs saw a rise in outperformance. This was brought to an abrupt halt with the Mexican Peso devaluation in December 1994. Afterwards, EMs continued to struggle, increasingly as the Asian Financial Crisis precipitated more currency devaluations.
However, the 2000s gave way to ‘re-emerging markets’, as China joined the World Trade Organisation and kickstarted the commodity ‘super-cycle’, characterised by increased demand for raw materials. EMs began to perform relatively strongly and reached similar levels of outperformance as the mid-1990s. The Global Financial Crisis then proved a turning point, decreasing investors' appetite for risk and shifting performance towards DMs. Since then, momentum stocks have been the focus for investors, with US markets leading the way, bolstered by tech and FAANG stocks.
Chart 1: The twin peaks of EM relative performance
Source: Refinitiv Datastream/Smith & Williamson Investment Management LLP, Data as at 08/06/2020
Now, we see 4 key reasons for why the scales may tilt towards EMs: 1) supportive valuations, 2) a Chinese economic rebound, 3) attractive risk-adjusted returns from similar starting points historically, and 4) the impact of a possible peak in the USD. Acute risks persist with US-Sino relations somewhat frosty and COVID-19 is less under-control in some EMs. On balance these risks should be mitigated and we think the story lends itself in favour of taking a fresh look at EMs. Looking forward, we model how this outperformance may materialise.
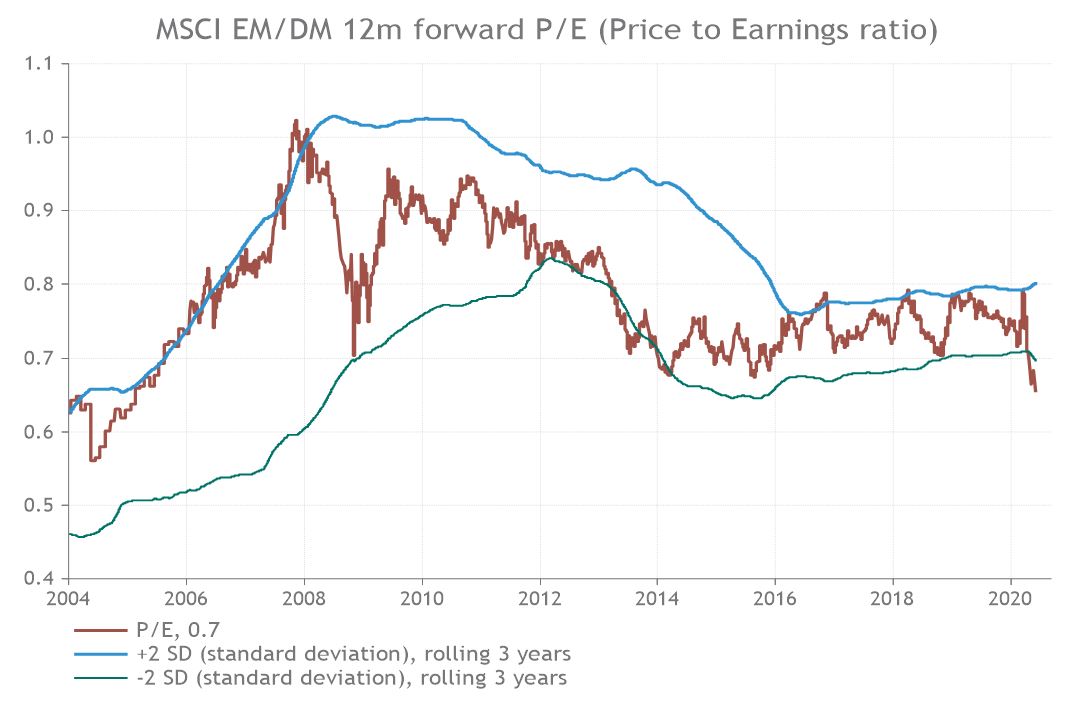
1. Supportive valuations. As we can see in chart 2,EMs are currently trading at a discount to DMs. This is to be expected, given that EMs are assumed to entail more risk but at a 35% difference, EMs are at their cheapest since 2005. Moreover, the recent COVID sell-off has left the discount outside of its 2-year standard deviation band, representing a large divergence from normal levels.
Chart 2: Supportive valuations for Emerging Markets
Source: Refinitiv Datastream/Smith & Williamson Investment Management LLP, Data as at 08/06/2020
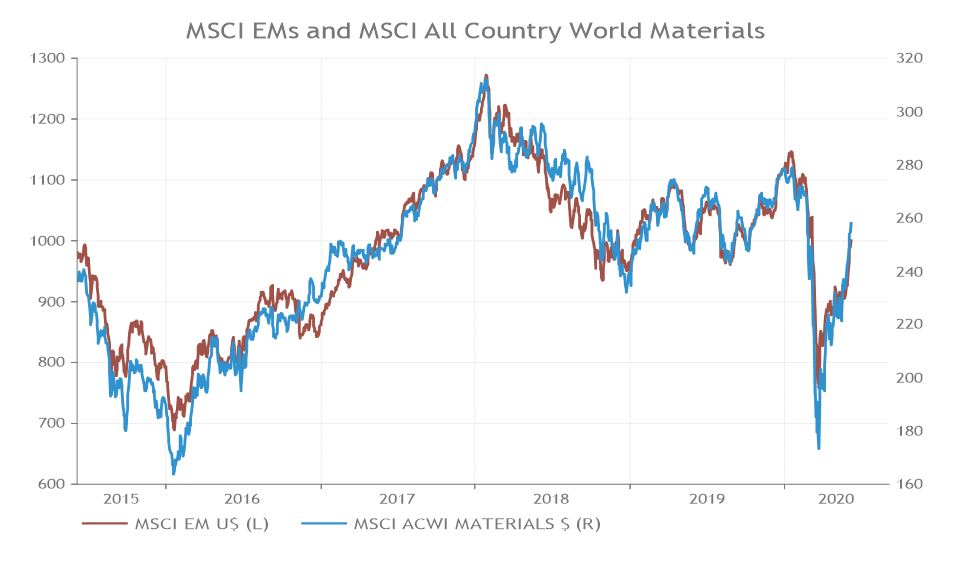
2. China’s economic recovery is driving demand for materials and consequently EMs. China, as the first economy to enter and emerge from COVID-19, is setting the precedent for economic recoveries. Positively, this is V-shaped. As China recovers, it drives demand for materials through its large manufacturing base. Chart 3 demonstrates the correlation between equities in the materials sector and EMs. The upwards trajectory of materials, displayed, should act as a tailwind. Further, China represents 38% of MSCI EM index so to a large extent the fates of EMs are entwined with China1. Other Asian based EMs have also handled COVID-19 relatively well and so have seen less disruption.
Chart 3: Chinese economic recovery should drive Emerging Market returns
Source: Refinitiv Datastream/Smith & Williamson Investment Management, Data as at 08/06/2020
3. Thirdly, EMs have historically provided better risk-adjusted returns during the ‘recovery’ phase of the economic cycle. Our in-house Tactical Equity Allocator (TEA – an aggregate of economic and financial data), suggests that we are currently in the ‘contraction’ phase, thanks to the impact of COVID-19. Looking to the future and the subsequent ‘recovery phase’, EMs are set to deliver the best risk-adjusted returns by region. By comparing historic data, one measure of risk adjusted performance, the Sharpe ratio, show that EMs score 2.0, double that of the US. Portfolios should therefore likely be tilted towards EMs in anticipation of an economic recovery.
Chart 4: Sharpe Ratios during different phases of S&W’s TEA indicator
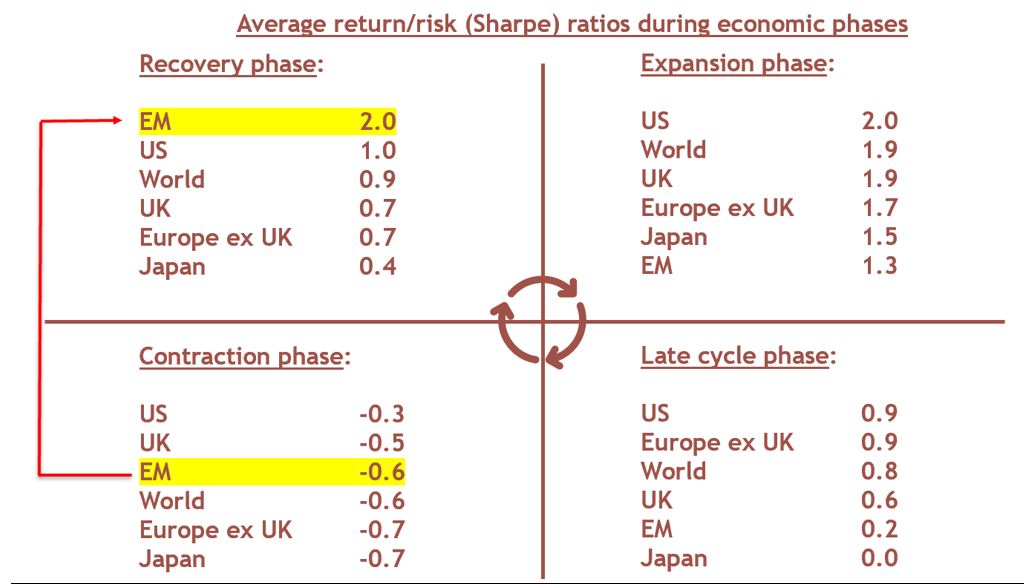
Sharpe ratios = return per unit of risk. The higher the value, the better the performance for S&W’s Tactical Equity allocator. In the recovery period, for example, EMs have the best Sharpe ratio and therefore offers the best risk-adjusted return. Source: Smith & Williamson Investment Management LLP/Refinitiv Datastream, data as at 5 May 2020
4. Finally, a weakening dollar will benefit EMs. Chart 4 demonstrates the relationship between the strength of the dollar and relative EM performance. As noted, the last decade has seen momentum and US stocks dominate, both contributing to the increased strength of the dollar. This has been further exacerbated due to recent inflows into the dollar, due to its ‘safe haven’ status, amidst COVID-19. Large quantities of dollar-denominated debt held by EMs mean that in times of dollar strength, the cost of servicing their debt increases. In May, the dollar depreciated by roughly 4%. With record US money supply likely to trickle into the global market, the balance of probabilities would indicate further depreciation. This should translate into stronger EM currencies and ultimately, EM equity outperformance, especially we think in Asia.
Chart 5: A weakening dollar is beneficial for Emerging Markets
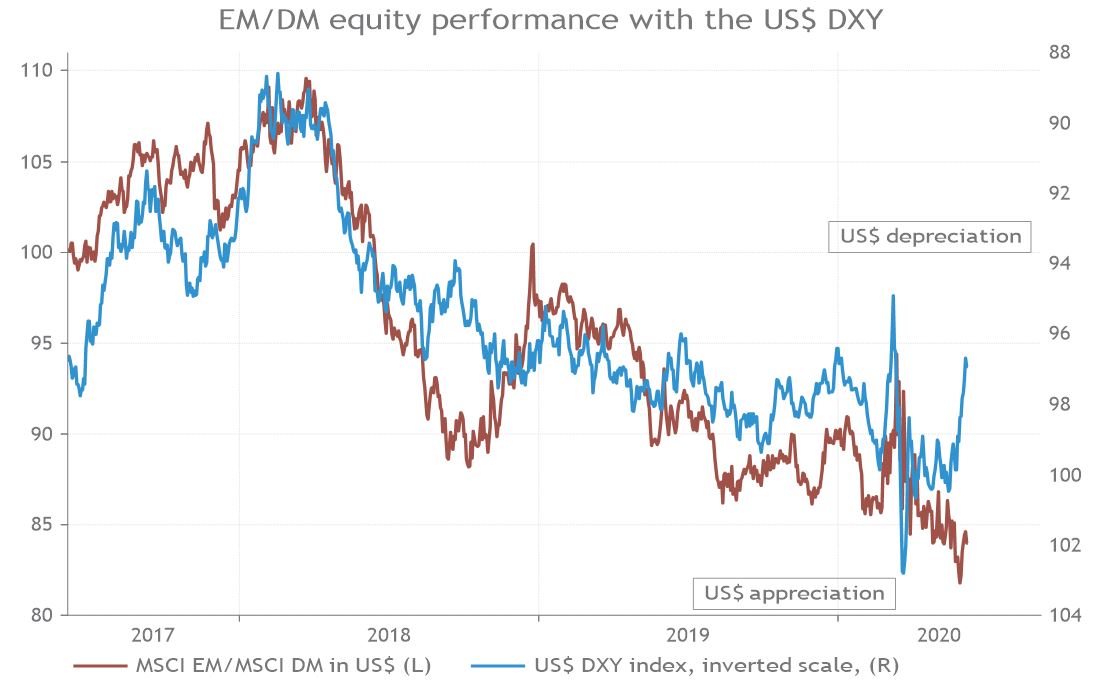
Source: Refinitiv Datastream/Smith & Williamson, Data as a 08/06/2020
Risks to this outlook persist. Sino-US relations have been tense, with rhetoric on both sides stepping up. The S&W trade sentiment index has historically acted as a barometer for the strength of the RMB. With the possibility of increased tariffs coming into play, logic would suggest decreased trade sentiment, along with a depreciation of RMB. Essentially, the same impact as an appreciating dollar. Whilst this remains a current risk, trade sentiment has not dipped aggressively, recently. This is due to two factors. Firstly, if the Chinese purposefully devalue the RMB, the possibility of a trade deal evaporates. Secondly, President Trump will be unlikely to increase protectionist measures given the upcoming election and its potential impact on the current weak economy. For now, whilst words may fly, we see a somewhat tacit agreement keeping trade sentiment and the RMB stable.
Chart 6: Emerging Markets are vulnerable to RMB devaluation risk
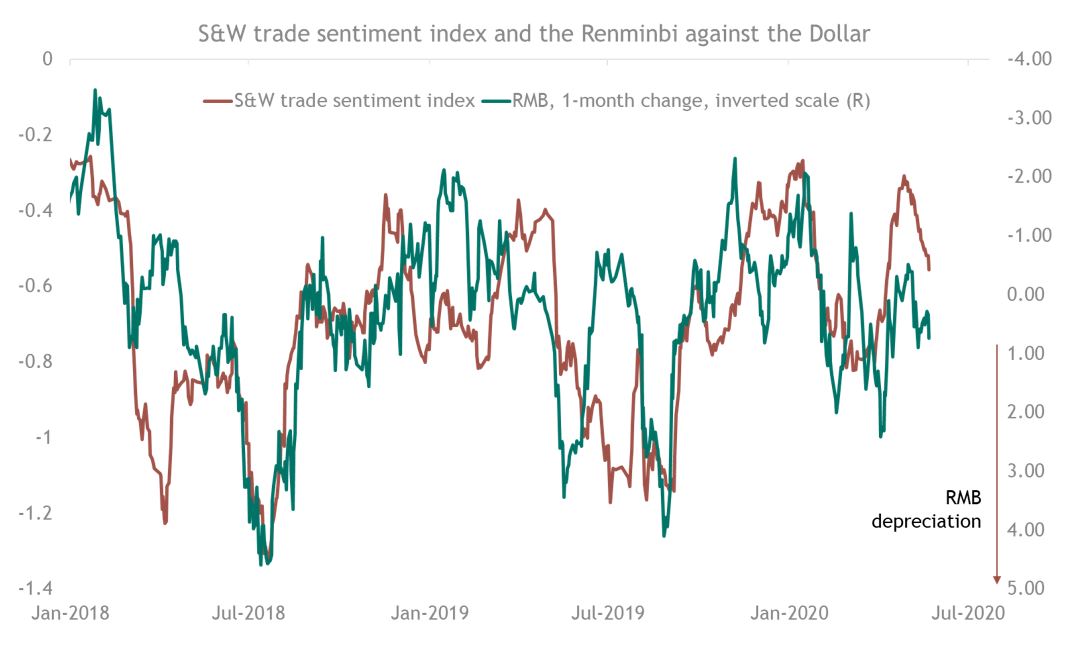
Source: Bloomberg/Refinitiv Datastream/Smith & Williamson, Data as a 08/06/2020
Similarly, emerging market currency strength can be linked to US economic policy uncertainty, as measured by press articles. Chart 7 shows that whilst a gap has evolved since 2018, there is a correlation. As uncertainty increases, the dollar appreciates. Given COVID risks, election uncertainties and the mercurial nature of President Trump, previous levels of economic policy certainty may not return in the short-term. However, as normality returns after lockdowns, US economic policy uncertainty is dropping from 5-year highs. Emerging market currencies are yet to catch up, suggesting we should see some upside soon.
Chart 7: US economic policy uncertainty strengthens the dollar
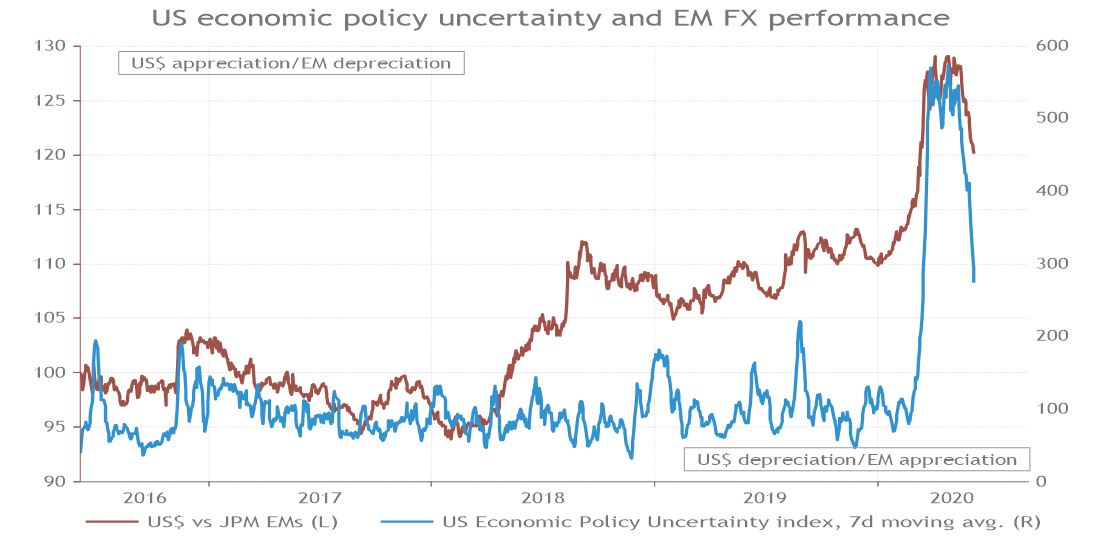
Source: Refinitiv Datastream/Smith & Williamson, Data as a 08/06/2020
Further risks come from COVID-19 and trade deficits. The COVID-19 curve has yet to flatten for many emerging market countries. Although there are tentative signs of this happening, daily deaths per 100m population are close to their peak. Given weaker health systems and limited fiscal and monetary tools, a second global outbreak of the virus could serve to widen the gap between developed and emerging markets.
Our final risk lies in the balance of payments imbalances of externally vulnerable EM countries’ trade balances. Large trade deficits have the capacity to weaken economies. The beginning of 2020 saw the ‘fragile six’ (Argentina, Turkey, Brazil, South Africa, India and Indonesia) have a net trade deficient of over $20bn2. However, this has recently decreased to near $5bn and thus we see diminished risk.
The conditions for a re-emergence of relative EM outperformance and the subsequent risks, contain a variety of variables. On balance, the scales should begin to tilt towards emerging markets and investors should consider just how this performance may look. The 1-year forward relative performance of MSCI EM vs MSCI DM based on different scenarios involving economic recovery (as measured by the S&W TEA) and dollar strength (as reflected in the dollar trade-weighted index against EM currencies), in chart 8 gives a sense of this. In a scenario with no recovery and ‘flat’ USD, we calculate that EMs should underperform DMs by around 5%. However, if we are to see a recovery and the dollar remaining flat, we expect to see an outperformance of 11% and 28% should the dollar fall 10%. The influence of the dollar cannot be understated. In a recovery scenario with dollar appreciation, EMs would likely underperform DMs. Investors must take a view on both the outlook of the dollar and economic recovery in conjunction when considering a portfolio’s weighting towards EMs.
Chart 8: Emerging market relative performance in different scenarios
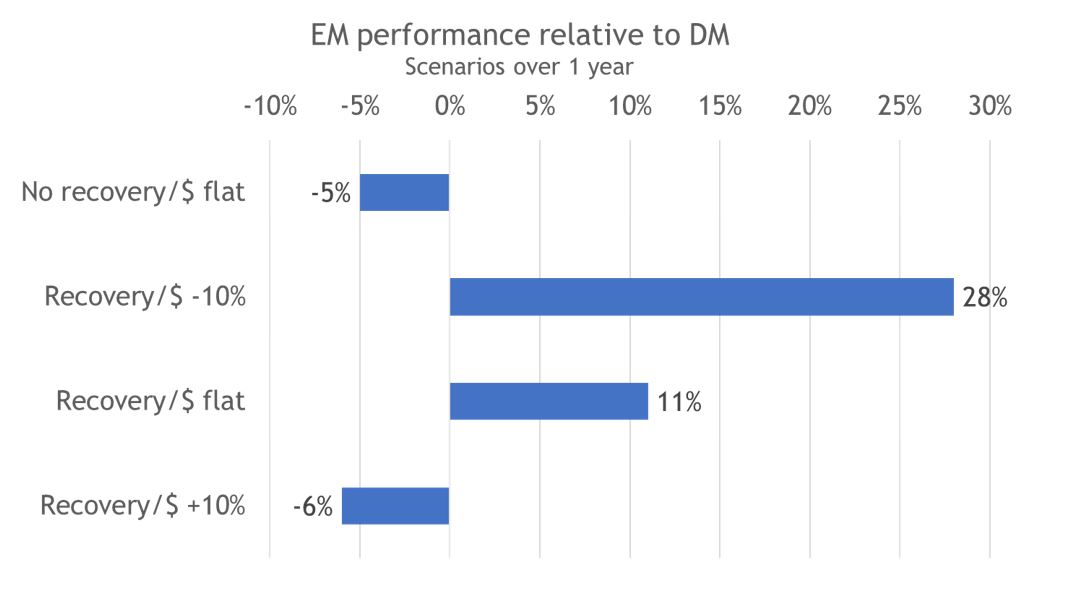
Source: Refinitiv Datastream/Smith & Williamson, Data as a 08/06/2020
To conclude, the relative underperformance of EMs over DMs that has persisted for the last decade and could begin to tilt in the opposite direction. The US and momentum stocks have led returns, but as we begin to move towards the recovery phase of the economic cycle, it is worth considering that EMs have historically outperformed here. Valuations, Chinese economic recovery, historic risk adjusted returns and a weakening dollar give weight to this idea. Risks do remain, prominently in political, economic and health uncertainty, yet on balance we remain titled towards increased EM outperformance. The extent to which EMs may outperform varies from scenario to scenario. Investors looking to increase EM exposure should colour their views with both the outlook of the dollar combined with economic recovery.
Sources
- Morningstar/ Smith & Williamson Investment Management LLP, 08/06/2020
- Refinitiv Datastream/ Smith & Williamson Investment Management LLP, 08/06/2020
Risk warning
Investment does involve risk. The value of investments and the income from them can go down as well as up. The investor may not receive back, in total, the original amount invested. Past performance is not a guide to future performance. Rates of tax are those prevailing at the time and are subject to change without notice. Clients should always seek appropriate advice from their financial adviser before committing funds for investment. When investments are made in overseas securities, movements in exchange rates may have an effect on the value of that investment. The effect may be favourable or unfavourable.
DISCLAIMER
By necessity, this briefing can only provide a short overview and it is essential to seek professional advice before applying the contents of this article. This briefing does not constitute advice nor a recommendation relating to the acquisition or disposal of investments. No responsibility can be taken for any loss arising from action taken or refrained from on the basis of this publication. Details correct at time of writing.
Evelyn Partners Investment Management LLP
Authorised and regulated by the Financial Conduct Authority.
Registered in England No. OC 369632. FRN: 580531
Evelyn Partners Investment Management LLP is part of the Evelyn Partners group.
© Evelyn Partners Group Limited 2021
Ref: 88720lw
Return to the COVID-19 Investment page Return to the COVID-19 homepage
